Platforms and projects
The cro-stat.com and cro-climate.com platforms bring official statistical and climate data on Croatia together in one place, in a form suited to analysis and decision making. Data are retrieved and refreshed automatically from the original databases of the Croatian Bureau of Statistics, Eurostat, the Croatian National Bank and climate data services.
-
cro-stat.com
Subscription data platform on the Croatian economy. More than 180 interactive charts and maps from nine official sources, including the Croatian Bureau of Statistics, the Croatian National Bank and Eurostat, with comparisons with the EU-27 and the euro area. Series are updated automatically after new releases, and part of the content is free.
Developed by OpenMacro
-
cro-climate.com
Public data service on the climate of Croatia. Observations and projections for temperature, precipitation and drought, fire danger, heating and cooling demand, floods and urban heat islands, by cadastral municipality, municipality and city, and county. The data are available for download.
Developed by OpenMacro
Access
Part of cro-stat.com is open to everyone, and the detailed thematic pages are available by subscription. cro-climate.com is a public service. Its content is published under the CC BY 4.0 licence, and the data under the licences of their sources.
The platforms are developed and maintained by OpenMacro.
Selected analytical projects
Examples of spatial analysis, satellite data processing and climate projections for Croatia and Europe.
Spatial analysis
Georeferencing of assets
An example of an interactive map linking asset locations to spatial data on exposure to climate risks.
Satellite observation and vegetation
NDVI, satellite-based vegetation assessment
The Normalised Difference Vegetation Index (NDVI) is used to assess the density and health of vegetation from satellite imagery. The data were downloaded from the Copernicus database as a TIFF file and clipped to the borders of Croatia.
Colours on the map show the level of vegetation. Greener shades indicate denser and healthier vegetation. Red, pink and pale shades point to sparse vegetation or bare, rocky surfaces. Yellow areas show moderate or transitional vegetation, such as grassland or farmland in the early stages of crop growth.
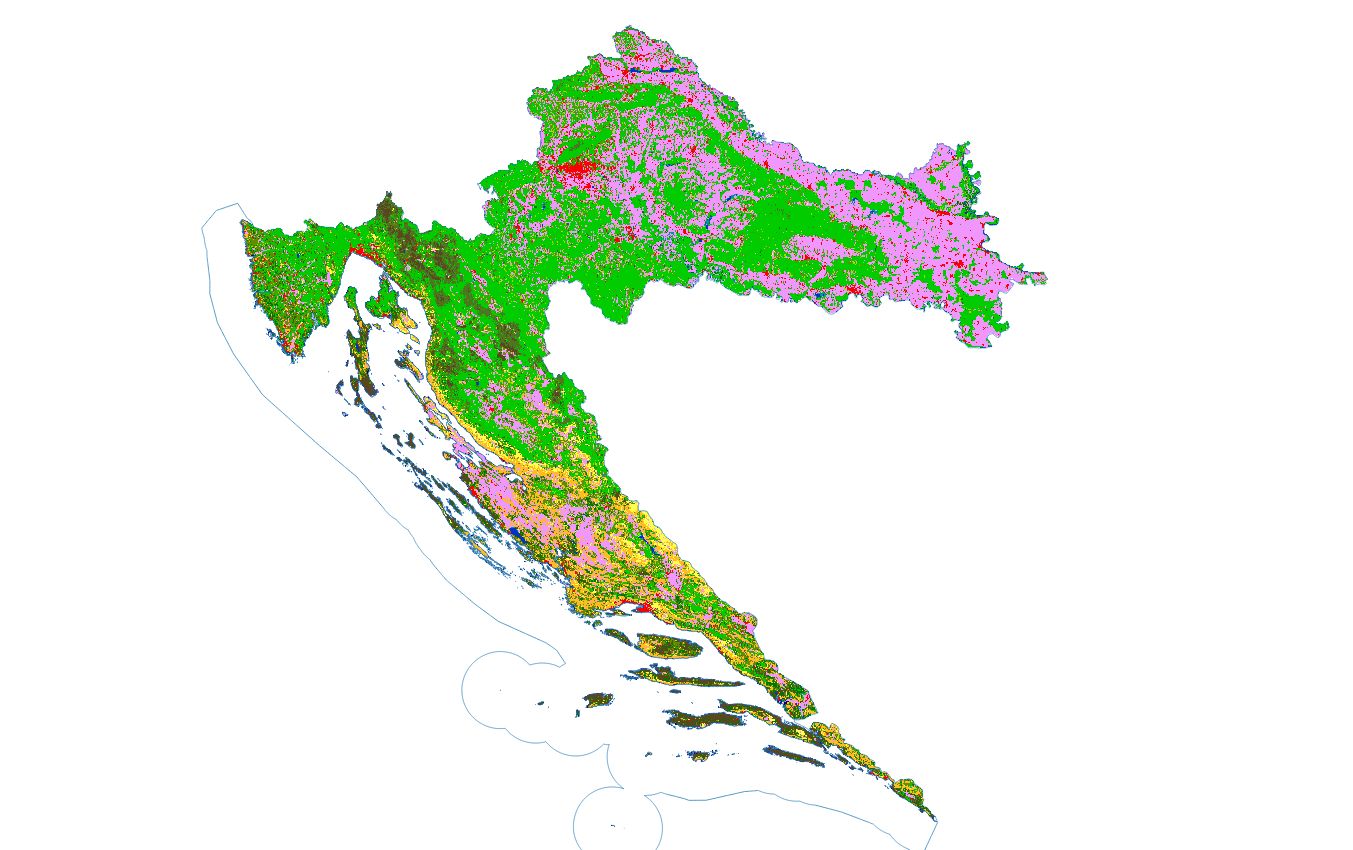
NDVI is used in agriculture to monitor crop health and forecast yields, in ecology to track changes in ecosystems, in resource management to monitor drought and irrigation, and in climate change research to follow changes in vegetation.
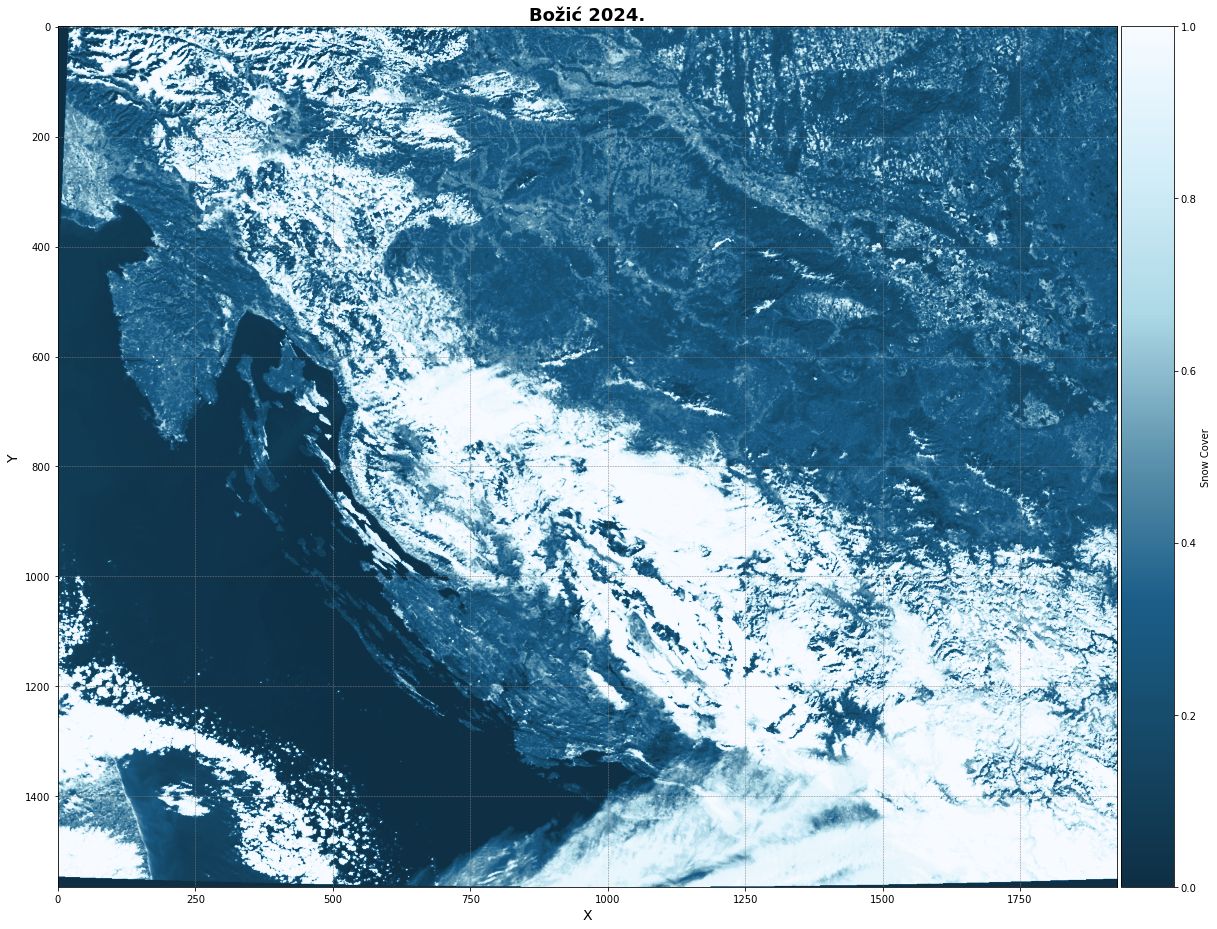
Snow cover seen from space
Climate projections for Croatia and Europe
- Climate projections point to rising sea levels across Europe, except in the north around Sweden and Finland, where sea levels are expected to fall.
- The largest increase in average annual temperature is expected in mountain areas such as the Alps, Dinara and Velebit.
- As average annual temperatures rise, fewer frost days, milder winters and less frequent extreme cold are expected, which could substantially reduce heating needs.
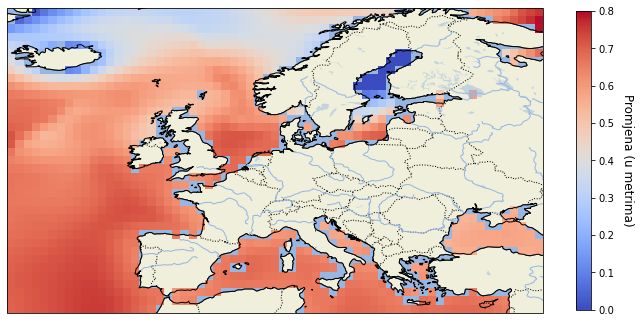
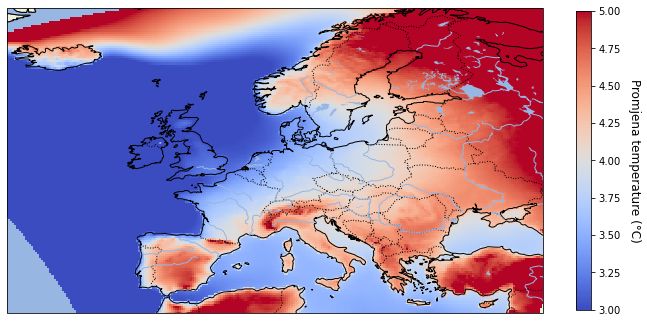
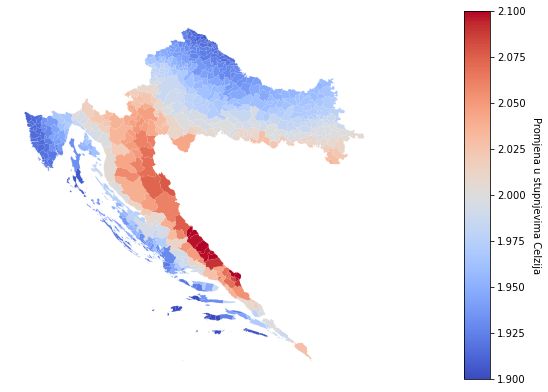
A detailed account of how climate change could affect Croatian regions, macroeconomic variables and risk management is given in the paper Macroeconomics of climate change, an overview of climate projections and their impact on the economy and financial system of Croatia (in Croatian).
Number of days above 35 °C
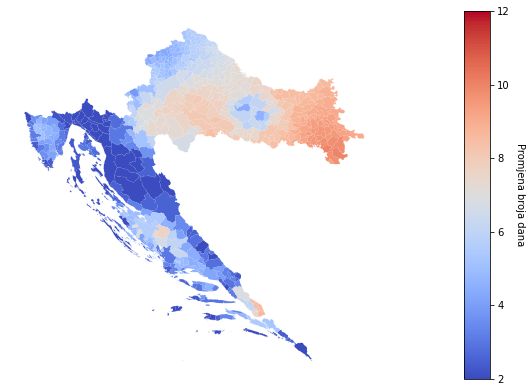
As average annual temperatures rise, the number of days above 35 °C is also expected to increase. The first map (RCP4.5) shows a more moderate rise in extremely hot days, reflecting the effect of mitigation. Darker blue shades mark areas with smaller changes, and lighter blue and orange shades moderate to large changes.
The second map (RCP8.5) shows a much larger number of hot days in eastern Croatia. Red shades mark areas where the number of extremely hot days could rise by more than 10 compared with the 1981 to 2010 reference period.
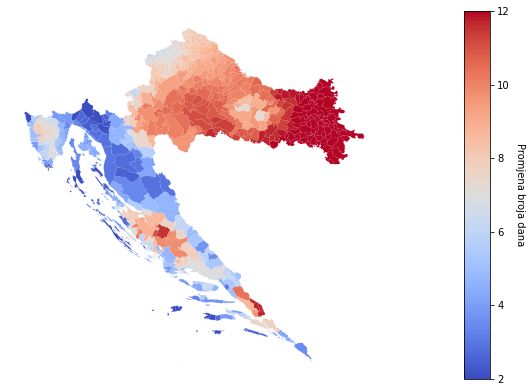
More frequent heatwaves pose serious risks to health. Extreme heat also reduces labour productivity and the availability of workers, and may drive migration, with effects on labour supply, wages, inequality and both supply and demand.
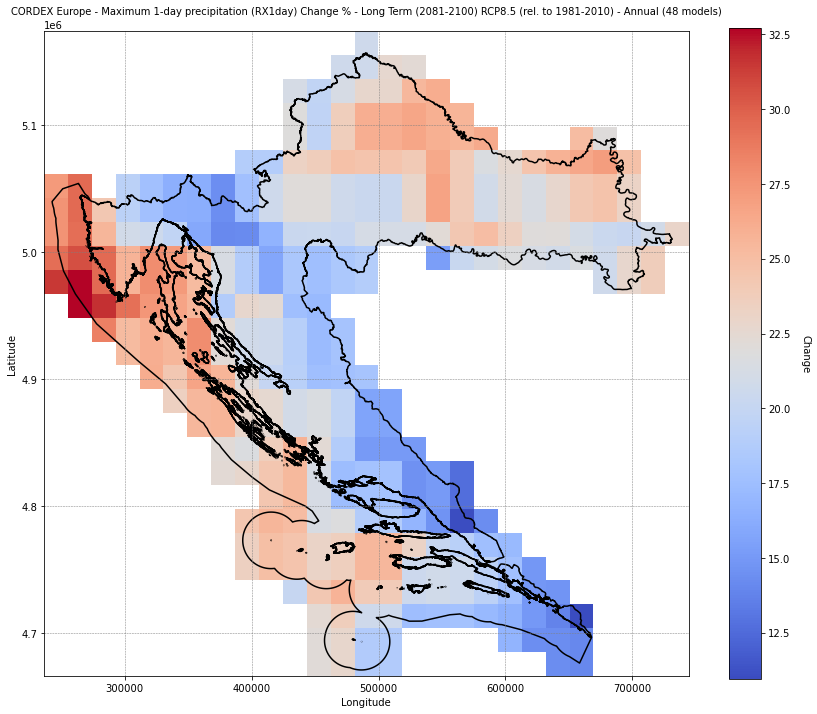
The maps are based on raster data from the Intergovernmental Panel on Climate Change (IPCC) and show CORDEX simulations for 2041 to 2060 under two emissions scenarios. RCP4.5 assumes moderate emissions with mitigation, and RCP8.5 assumes high emissions with no additional measures.
Further projections
%20Change%20%20-%20Medium%20Term%20(2041-2060)%20RCP8.png)
Greenhouse gas emissions and sinks
In Croatia, as in the euro area, energy is the largest source of greenhouse gas emissions, accounting for about 70% of total emissions in Croatia and 80% in the euro area. Energy emissions are divided into five sub-sectors, the most important being energy transformation (mainly electricity and heat generation from fossil fuels), transport and general consumption (residential and commercial buildings).
Over the past thirty years energy transformation accounted for about 20% of total emissions in Croatia and 27% in the euro area, with a clear downward trend. Transport emissions have risen steadily in recent years and overtook emissions from energy transformation in the last year observed. In 2020 transport accounted for 24% of total emissions in Croatia and 23% in the euro area, most of it from road transport.
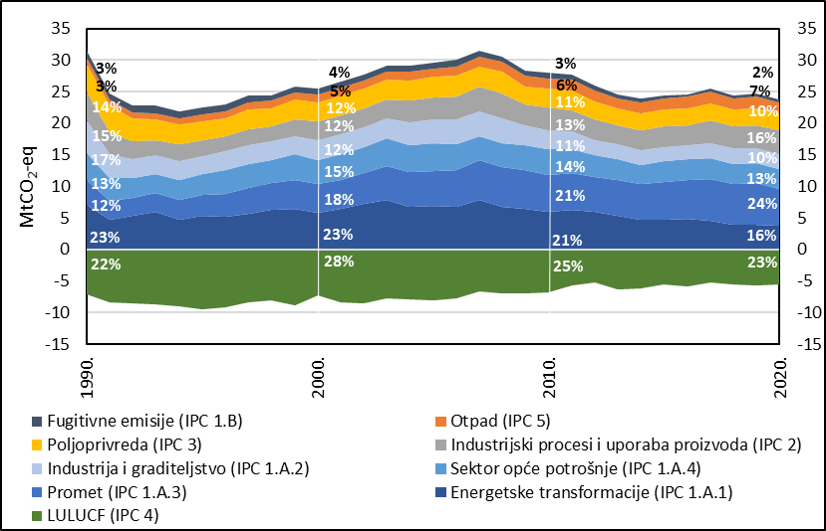
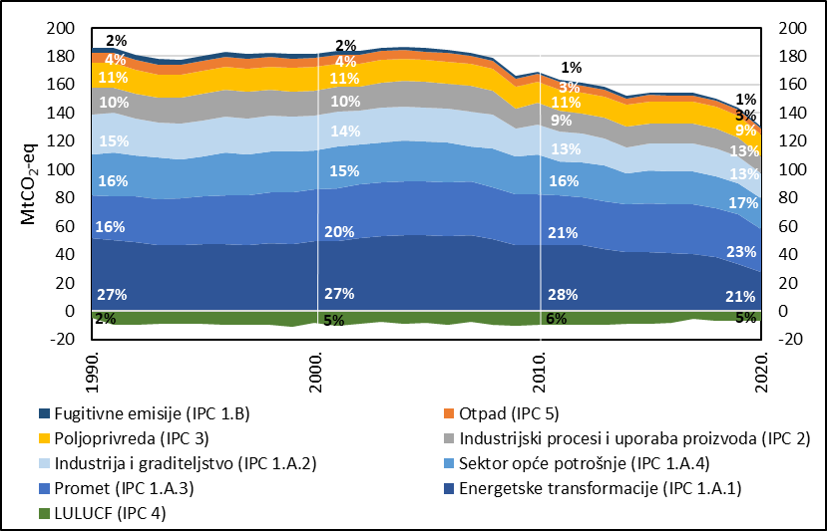
Note. Emission sources and removals in the dataset follow the IPCC Common Reporting framework, also used by the UNFCCC, and are divided into five sectors, namely energy, industrial processes and product use (IPPU), agriculture, land use, land-use change and forestry (LULUCF), and waste. Energy is subdivided into energy transformation, industry and construction, transport, general consumption and fugitive emissions. Euro area values are the euro area average excluding Croatia. Shares may not sum to 100% because of rounding. Source is the author’s calculation based on UNFCCC data.